TL;DR: Amazon seasonality drives sales spikes; mastering its patterns lets you optimize pricing, inventory, and Q4 campaigns.
Key Takeaways
- Identify the seasonal peaks that generate the most sales on Amazon.
- Apply data‑driven inventory and pricing tactics for holiday and Q4 periods.
- Use forecasting tools to predict demand and avoid stock‑outs.
Table of Contents
Note on marketplaces: This guide is specifically optimized for the US market.
Understanding Amazon Seasonality
Seasonality on Amazon refers to predictable fluctuations in consumer demand throughout the year. Major holidays, school calendars, and weather‑driven events create recurring sales peaks and troughs. By analyzing historic sales data, sellers can pinpoint when their category experiences its highest conversion rates. This insight helps you allocate marketing spend, adjust pricing, and prepare inventory well before the surge.
For a broader view of Amazon analytics, visit our Amazon Seller Analytics Guide.
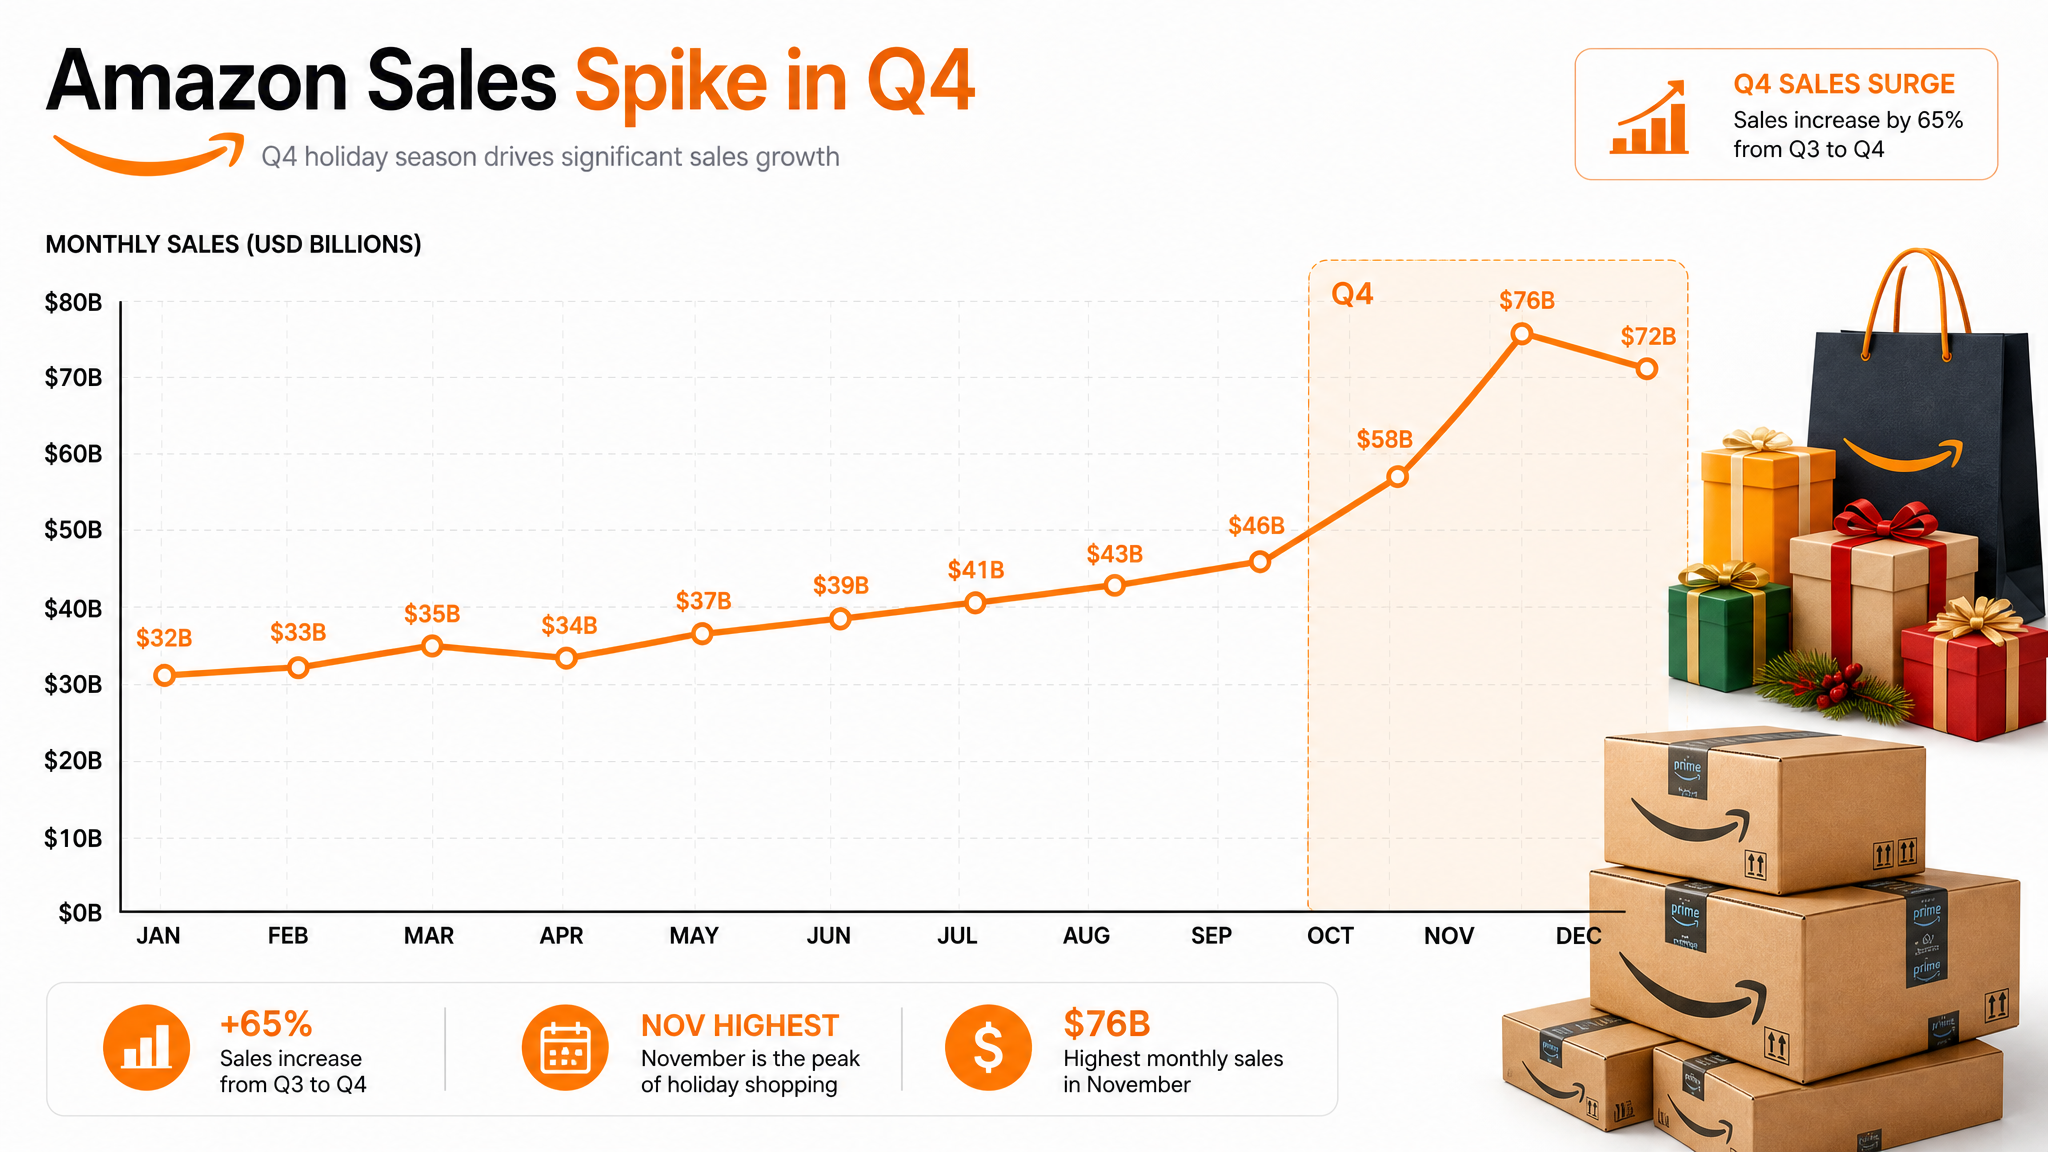
For a deeper dive, check out our Amazon Category Analysis Guide, which walks you through building category‑level seasonality curves. New sellers often overlook the power of seasonality, treating it as a "nice‑to‑know" rather than a core planning pillar.
Strategic Planning for Peak Seasons
Once you have identified peak windows, typically October through December for most consumer categories, you can execute three interlocking strategies: inventory optimization, dynamic pricing, and promotional timing. Begin by projecting the required units using the formula: Forecast = Avg Daily Sales × Days × Growth Factor. Align this forecast with Amazon's shipment‑lead‑time to schedule inbound freight at least 4‑6 weeks in advance.
Dynamic pricing tools allow you to raise prices modestly (5‑10 %) when demand outpaces supply, then revert to standard rates post‑peak. This approach maximizes profit without alienating price‑sensitive shoppers. Pair pricing changes with limited‑time lightning deals or coupons to capture the "last‑minute shopper" segment, especially on Black Friday and Cyber Monday.
Inventory‑first tactics include building a safety stock buffer of 15‑20 % above forecasted demand, using Amazon's Inventory Performance Index (IPI) to monitor health, and leveraging the "Restock Inventory" tool for automated replenishment. For brands with multiple SKUs, prioritize top‑selling items and consider bundling slower movers with best‑sellers to improve overall turnover.
If you need a ready‑made solution, our SellerSprite platform provides demand forecasting, seasonal keyword research, and automated inventory alerts, essential for both growing and established sellers.
FAQ
How does seasonality affect product pricing on Amazon during the holiday season?
During peak holiday weeks, buyer demand often exceeds available inventory, allowing sellers to implement modest price increases (typically 5‑10 %). However, aggressive pricing can backfire if competitors launch deep‑discount promotions. The key is to use dynamic pricing software that reacts to real‑time buy‑box metrics, preserving profitability while staying competitive.
What inventory management tactics should Amazon sellers use for peak sales months in the US?
Plan inventory 4‑6 weeks ahead, calculate a safety‑stock buffer of 15‑20 % above forecasted demand, and monitor Amazon's IPI score daily. Utilize the "Restock Inventory" tool to automate shipment requests, and consider split‑shipment strategies (using multiple fulfillment centers) to reduce stock‑out risk during surges.
How can I forecast demand for my Amazon listings based on seasonal trends?
Start with Amazon's historical sales data (last 12‑18 months) and identify recurring peaks. Apply a moving‑average or exponential smoothing model, then layer in external factors such as holiday calendars, advertising spend, and competitor launches. Tools like SellerSprite's "Demand Forecast" module automate this calculation and provide confidence intervals for each SKU.
Next Steps
- Audit your past 12 months of sales to extract seasonal peaks.
- Use the forecast formula to set inventory targets for Q4.
- Implement dynamic pricing rules and schedule holiday promotions.
- Activate SellerSprite's demand‑forecasting dashboard to monitor accuracy.
References
- Amazon Category Analysis Guide View
- Amazon 2025 Annual Data Report View
- How to Track Amazon Top Sellers View
- Amazon Sales Estimator – Verify Demand Accuracy View
- Discovering Profitable Products – Strategies and Essential Tools View
By SellerSprite Team
The SellerSprite team combines years of Amazon marketplace expertise, data‑science background, and e‑commerce consulting experience to help sellers of all sizes unlock seasonal growth.